Y Combinator has funded approximately 5,668 unique companies since 2005, making it the world’s most influential startup accelerator. Their portfolio companies carry a combined valuation exceeding $600 billion.
But behind the headline numbers, the data tells a more nuanced story. Consumer startups are nearly extinct in recent batches. AI has become infrastructure rather than a category. Founding teams are shrinking even as successful companies scale bigger than ever. And against a decade of decentralization predictions, San Francisco is pulling founders back at record rates.
Methodology
This analysis is based on 5,668 companies listed in Y Combinator’s public directory, spanning batches from Summer 2005 through Winter 2026.
YC does not publish a single canonical “batch size” number. Reported cohort sizes vary depending on whether one counts companies funded by YC, Demo Day participants, or all companies listed under a batch in the public directory.
In this analysis, batch size refers to the number of companies listed under each batch in YC’s public directory, which may differ from officially announced cohort sizes or Demo Day participation counts.
Quick Stats: Y-Combinator at a Glance
Total companies funded: 5,668
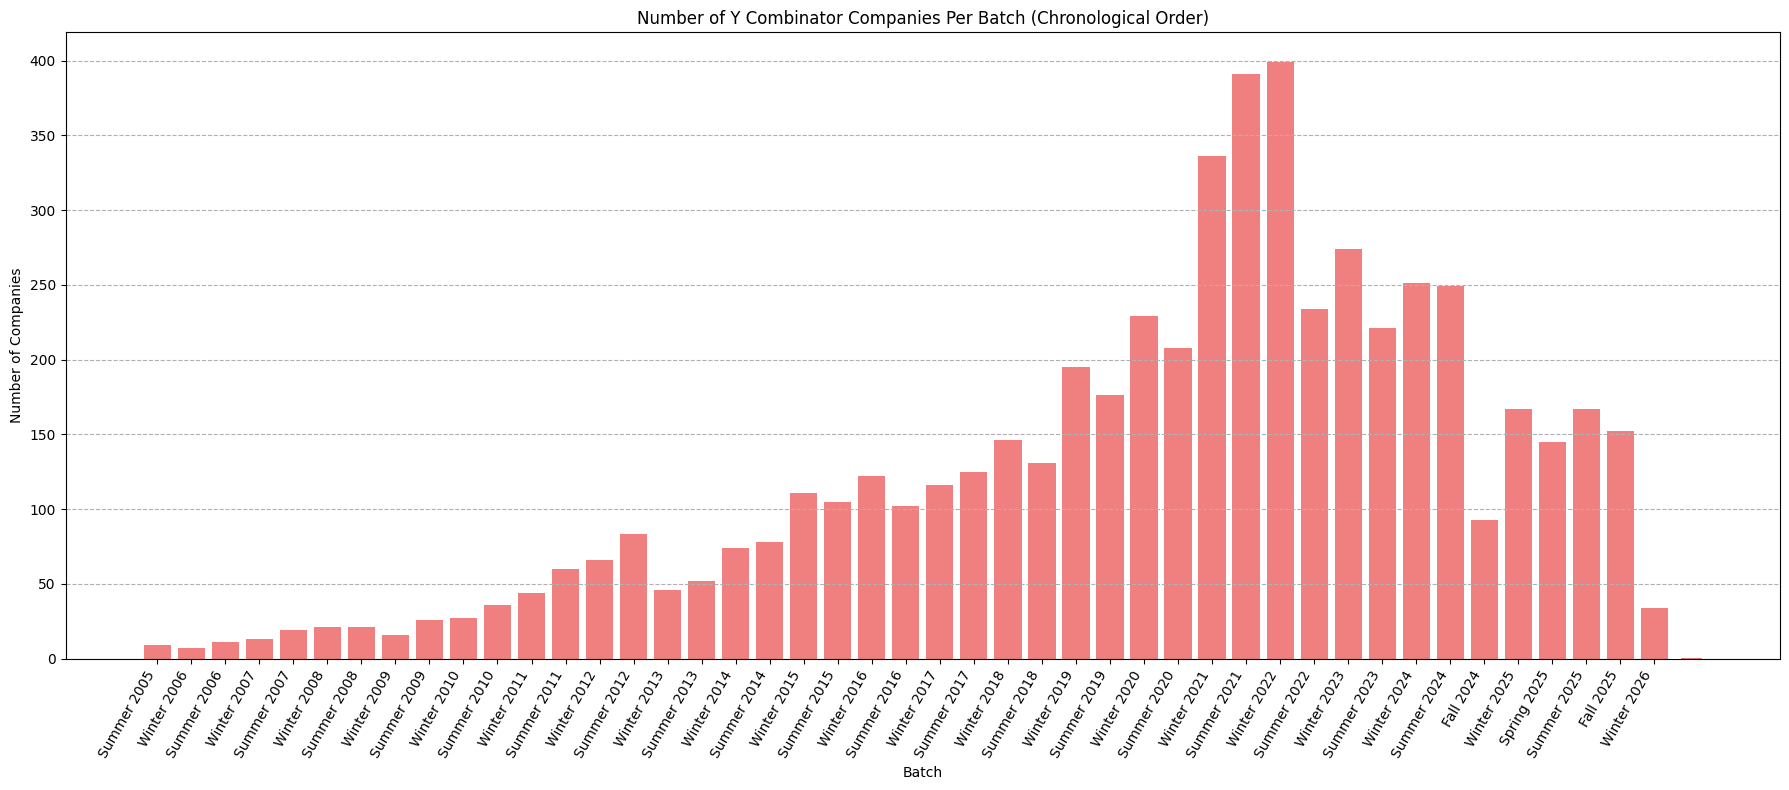
Largest single batch: Winter 2022 (~399 companies)
Peak year: 2021 (727 companies)
Active companies: 69.02%
Acquisition rate: 12.86%
B2B share: 84.47%
Median team size: 6 employees
US-based companies: 68.93%
Currently hiring: 25.16%
Y Combinator’s Evolution: From 9 Companies to Optimized Batches
Y Combinator began as a small summer program, funding just 9 companies in Summer 2005. Early experimentation with winter batches started in 2006, but it was not until 2011 that the now-familiar two-batch-per-year model stabilized.
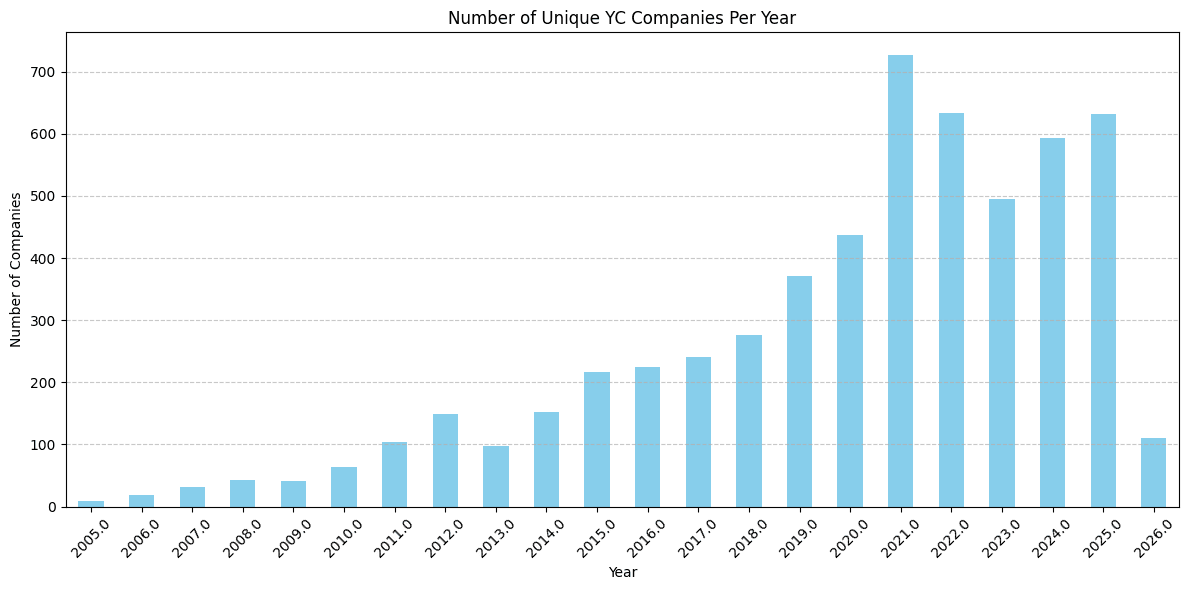
Number of unique companies per year:
| Year | Company Count |
|---|---|
| 2005 | 9 |
| 2006 | 18 |
| 2007 | 32 |
| 2008 | 43 |
| 2009 | 42 |
| 2010 | 63 |
| 2011 | 104 |
| 2012 | 149 |
| 2013 | 98 |
| 2014 | 152 |
| 2015 | 216 |
| 2016 | 224 |
| 2017 | 241 |
| 2018 | 277 |
| 2019 | 371 |
| 2020 | 437 |
| 2021 | 727 |
| 2022 | 633 |
| 2023 | 495 |
| 2024 | 593 |
| 2025 | 632 |
| 2026 | 111 |
Number of unique YC companies launched per season (Batch)
| Year | Summer | Winter | Fall | Spring |
|---|---|---|---|---|
| 2005 | 9 | 0 | 0 | 0 |
| 2006 | 11 | 7 | 0 | 0 |
| 2007 | 19 | 13 | 0 | 0 |
| 2008 | 22 | 21 | 0 | 0 |
| 2009 | 26 | 16 | 0 | 0 |
| 2010 | 36 | 27 | 0 | 0 |
| 2011 | 60 | 44 | 0 | 0 |
| 2012 | 83 | 66 | 0 | 0 |
| 2013 | 52 | 46 | 0 | 0 |
| 2014 | 78 | 74 | 0 | 0 |
| 2015 | 105 | 111 | 0 | 0 |
| 2016 | 102 | 122 | 0 | 0 |
| 2017 | 125 | 116 | 0 | 0 |
| 2018 | 131 | 146 | 0 | 0 |
| 2019 | 176 | 195 | 0 | 0 |
| 2020 | 208 | 229 | 0 | 0 |
| 2021 | 391 | 336 | 0 | 0 |
| 2022 | 234 | 399 | 0 | 0 |
| 2023 | 221 | 274 | 0 | 0 |
| 2024 | 249 | 251 | 93 | 0 |
| 2025 | 168 | 167 | 152 | 145 |
Early Years (2005 to 2010): Single Batch Experimentation
YC initially ran only summer batches, scaling gradually from 9 companies to 36 by 2010. Winter 2006 marked the first experiment with a secondary batch.
The Two-Batch Model (2011 to 2016): Steady Expansion
By 2011, YC consistently ran Summer and Winter batches. Growth was incremental and controlled.
2011: 104 companies total
2012: 149 companies
2016: 224 companies
The Scaling Era (2017 to 2020): Aggressive Growth
Batch sizes expanded rapidly while maintaining the two-batch structure.
2017: 241 companies
2019: 371 companies
2020: 437 companies
The Pandemic Peak (2021 to 2022): Maximum Output
YC reached unprecedented scale during the startup boom.
2021: 727 companies
2022: 634 companies
Winter 2022 remains the largest single batch in YC history.
Recalibration (2023 to Present): Quality Over Quantity
Post-peak, YC reduced batch sizes and introduced more flexible timing, including Fall and Spring cohorts.
2024: 593 companies
2025: 632 companies
2026: 110 companies so far
The data suggests YC deliberately stepped back from mega-batches in favor of tighter cohorts. Rather than running two massive cohorts, YC now appears to be experimenting with four smaller ones, keeping annual output stable while making individual batches more manageable and improving support, mentorship, and in-person programming.
Portfolio Health and Company Outcomes
Current Status of YC Companies
Active: 69.02 percent
Inactive: 17.71 percent
Acquired: 12.86 percent
Public: 0.41 percent
Nearly 7 in 10 YC companies are still operating, while acquisitions represent a meaningful share of successful exits.
Stage Distribution
Early stage: 81.70 percent
Growth stage: 18.30 percent
Currently hiring: 25.16 percent
YC continues to fund very early companies by design. Roughly 1 in 5 reach meaningful growth.
The B2B Shift That Never Reversed
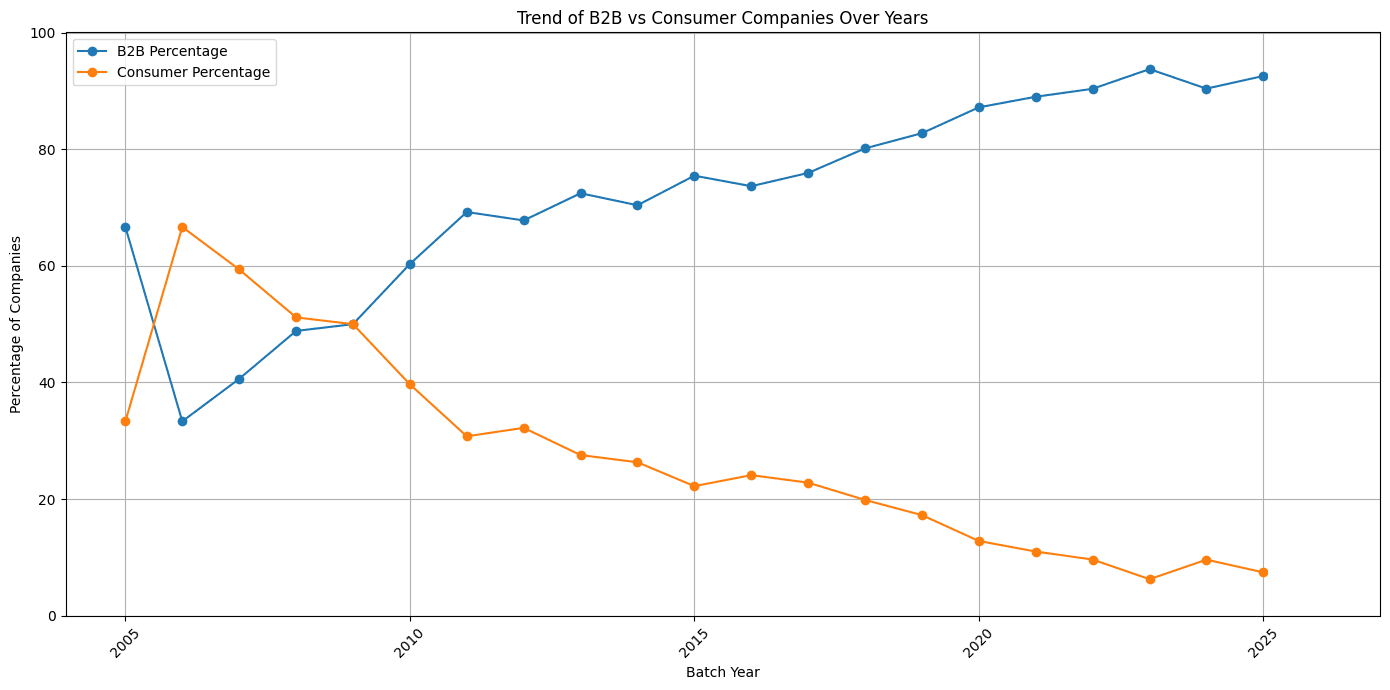
B2B Companies: 84.47% (4,788 companies)
Consumer Companies: 15.21% (862 companies)
Peak B2B Year: 88.78% (2013)
In 2005, consumer startups made up roughly one-third of YC companies. That share steadily declined throughout the 2010s. By 2013, B2B companies peaked at nearly 89 percent of each batch.
Today, consumer startups represent a structural minority. Even during YC’s largest ever cohorts, B2B dominance remained unchanged.
The graph makes this unmistakably clear. The B2B line climbs steadily through the 2010s, hits a brief plateau, then continues upward. The consumer line drifts lower year after year, with no sustained recovery.
This is not just a YC preference. It reflects broader market economics. B2B companies can charge from day one, build predictable subscription revenue, and demonstrate clear ROI.
Consumer companies face rising acquisition costs, platform dependencies, and markets dominated by incumbents with powerful network effects.
The data covers 2,863 B2B companies and 862 consumer companies, a ratio greater than 3:1 that has been widening for over a decade.
Which Industries Are Growing Fastest
Industry Concentration
Top industry: B2B (2,863 companies)
B2B accounts for the largest share of YC companies by a wide margin, reflecting a long-term shift toward business-focused products with clear buyers and revenue models.
Fastest-Growing Industries Post-2020
B2B: 2,050
Fintech: 429
Healthcare: 409
Most net new YC companies since 2020 are concentrated in these three sectors, with B2B driving the majority of growth and Fintech and Healthcare emerging as the strongest specialized verticals.
Top 10 Industries by Company Count
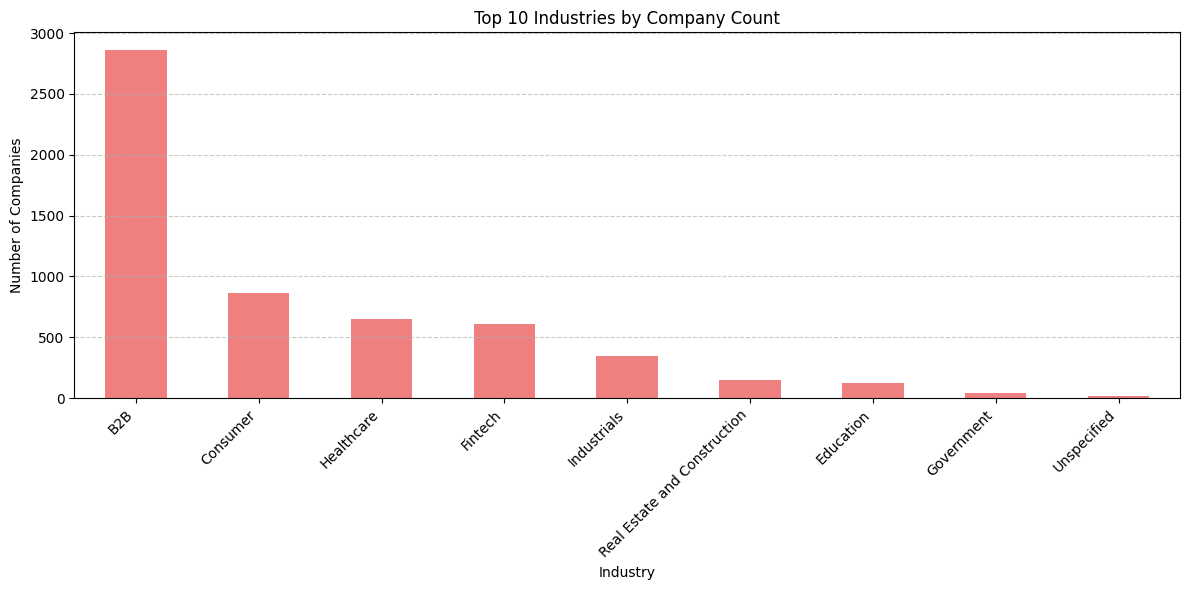
B2B: 2,863 companies
Consumer: 862 companies
Healthcare: 653 companies
Fintech: 606 companies
Industrials: 347 companies
Education: 241 companies
Real Estate: 214 companies
Government: 151 companies
Unspecified: 99 companies
Nonprofit: 42 companies
B2B has more than 3x the number of companies as Consumer. Healthcare and Fintech are the strongest specialized verticals.
The Explosion of Specialization
Founders are going deeper into verticals rather than broader across markets, building defensible niches based on domain expertise.
Examples of subindustry expansion:
Fintech to Insurance: 4 to 50 companies
Healthcare to Therapeutics: 0 to 64 companies
Industrials: 1 to 23 companies
The Language of Startups Changed Completely
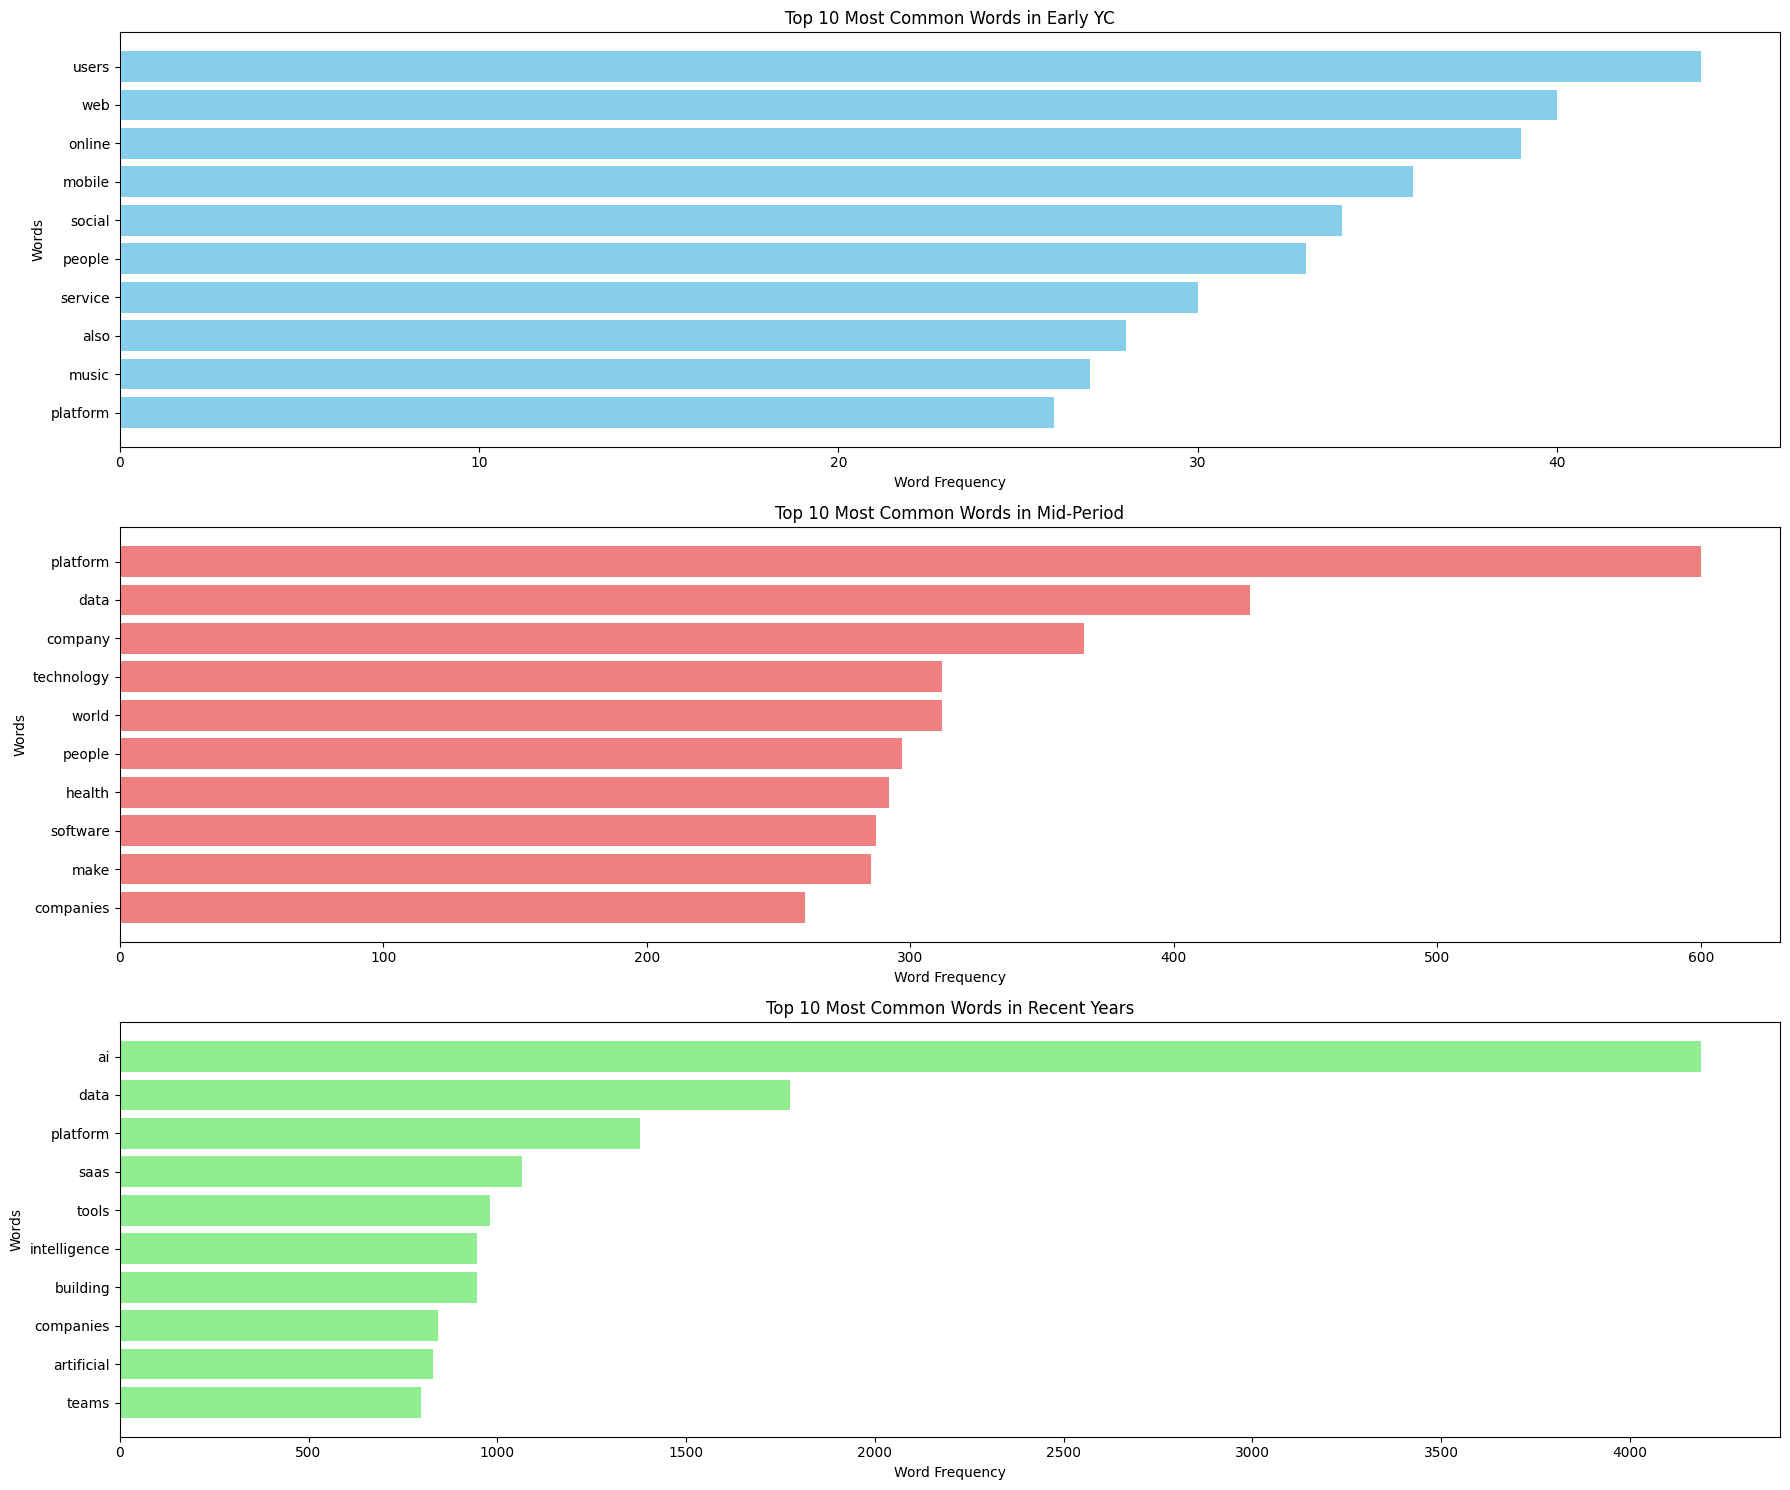
Early YC (pre-2010): Consumer Internet Era
The top words were users, web, online, mobile, social, people, service, music, and platform. This was the consumer internet era. Startups were building the foundational layer of digital life: social networks, music platforms, and mobile-first applications. Batches were tiny (9 to 26 companies per year), and the vocabulary reflects founders chasing consumer adoption.
Mid-Period (2010–2018): Enterprise Shift
The platform jumped to 600 mentions. Data reached 429. Company, technology, health, and software entered the top ten. The language became more enterprise-facing. B2B was winning, and founders were describing solutions rather than experiences. Batches grew to 100–150 companies annually during this period, and the vocabulary broadened accordingly.
Recent Years (post-2018): AI-Dominated Vocabulary
The transformation is staggering. "AI" appears 4,188 times, more than twice as often as "data" (1,776) and three times as often as "platform" (1,377). "SaaS" appears 1,065 times. "Tools," "intelligence," "artificial," and "teams" round out a top ten that looks nothing like early YC's consumer-internet vocabulary.
New terms appearing post-2019
New terms appearing post-2019: "LLMs" and "LLM" combined for 172 mentions. These words essentially did not exist in startup descriptions before 2019. "Copilot" appeared 67 times. "AIOps" appeared 53 times. "Outbound" emerged 51 times. These are not just buzzwords. Each represents a product category that was created or transformed by large language models in real time.
Most common tag combinations:
B2B + SaaS: 546 companies
Artificial Intelligence + B2B: 257 companies
AI + B2B: 248 companies
B2B + Fintech: 188 companies
Artificial Intelligence + SaaS: 186 companies
AI + SaaS: 180 companies
Fintech + SaaS: 163 companies
Developer Tools + SaaS: 162 companies
B2B + Developer Tools: 159 companies
Founding Teams Are Getting Smaller, But Winners Scale Bigger
The median team size across all 5,668 YC companies is 6 employees. But that aggregate number masks a fascinating divergence happening in real time.
Evolution of median founding team size
Early YC (2005-2009): 2-3 employees
Mid-period (2010-2022): 11-14 employees
Recent years (2023-2025): 3-5 employees
During the mid-period, as batch sizes grew from 100 to 400 companies, founding teams also grew. The abundance of capital, the expectation of rapid scaling, and perhaps YC's own selection criteria during that era favored larger founding teams.
That has reversed sharply. Recent batches, which are smaller and more concentrated, are funding companies with median founding teams of just 3–5 people. This likely reflects two things: the tools available to small teams have improved dramatically (AI, cloud infrastructure, no-code tooling), and YC may be actively selecting for capital-efficient teams that can validate faster with less.
Growth-stage companies tell the other half of the story
Of the 1,024 companies that reached the growth stage (roughly 18% of the total portfolio), the median team size is 50 employees, and the mean is 198.59. The maximum is 8,600. The barbell shape is stark: start with 3–5 people, prove the concept, then scale aggressively to hundreds.
Median team size by industry:
Fintech: 12.0
Education: 11.0
Healthcare: 8.0
B2B: 5.0
Consumer: 5.0
Fintech and Healthcare require larger founding teams from day one. Regulatory compliance, security requirements, and specialized expertise drive headcount earlier in the lifecycle. B2B and Consumer companies can start leaner.
Remote Work's Rise and Collapse
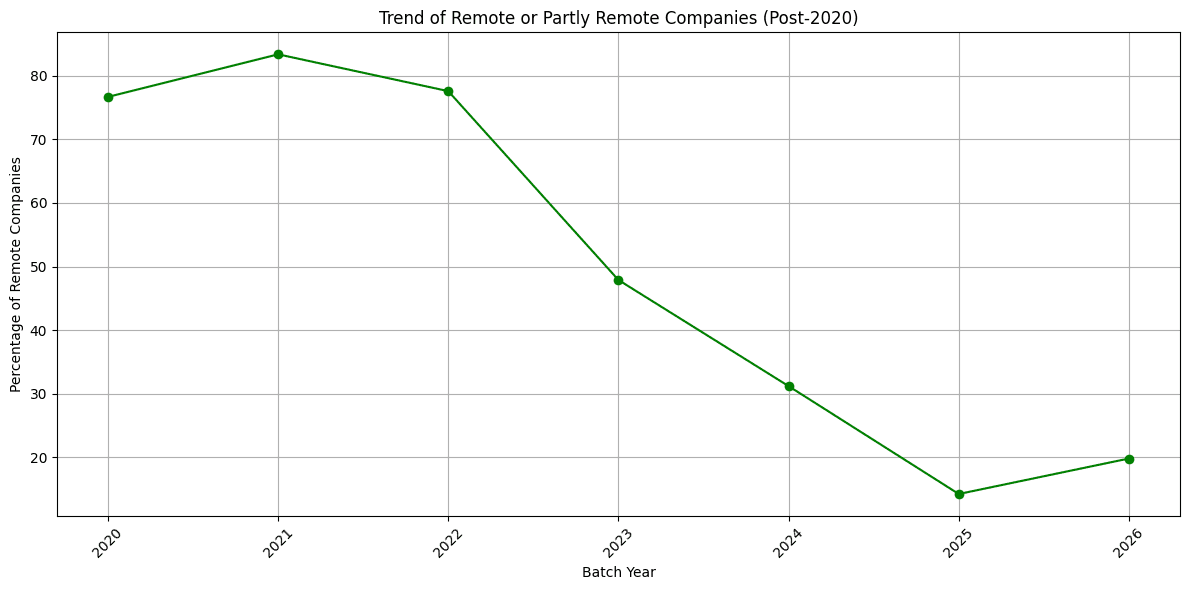
No trend in this dataset reverses as dramatically as remote work adoption.
Remote or Partly Remote Y Combinator Companies Over Time
2020: 33.64%
2021: 83.36%
2022: 77.57%
2023: 47.88%
2024: 31.20%
2025: 14.24%
2026: 19.82%
In 2021, when YC funded 727 companies in a single year, 83% of them were remote or partly remote. This was partly necessity, partly ideology. The pandemic had normalized distributed teams, and the startup world embraced it fully. YC ran its program remotely. Founders built from anywhere.
The reversal started immediately. By 2023, it was below 50%. By 202,5 it was 14.24%, lower than the 33.64% recorded in 2020 before the pandemic began.
San Francisco's Comeback
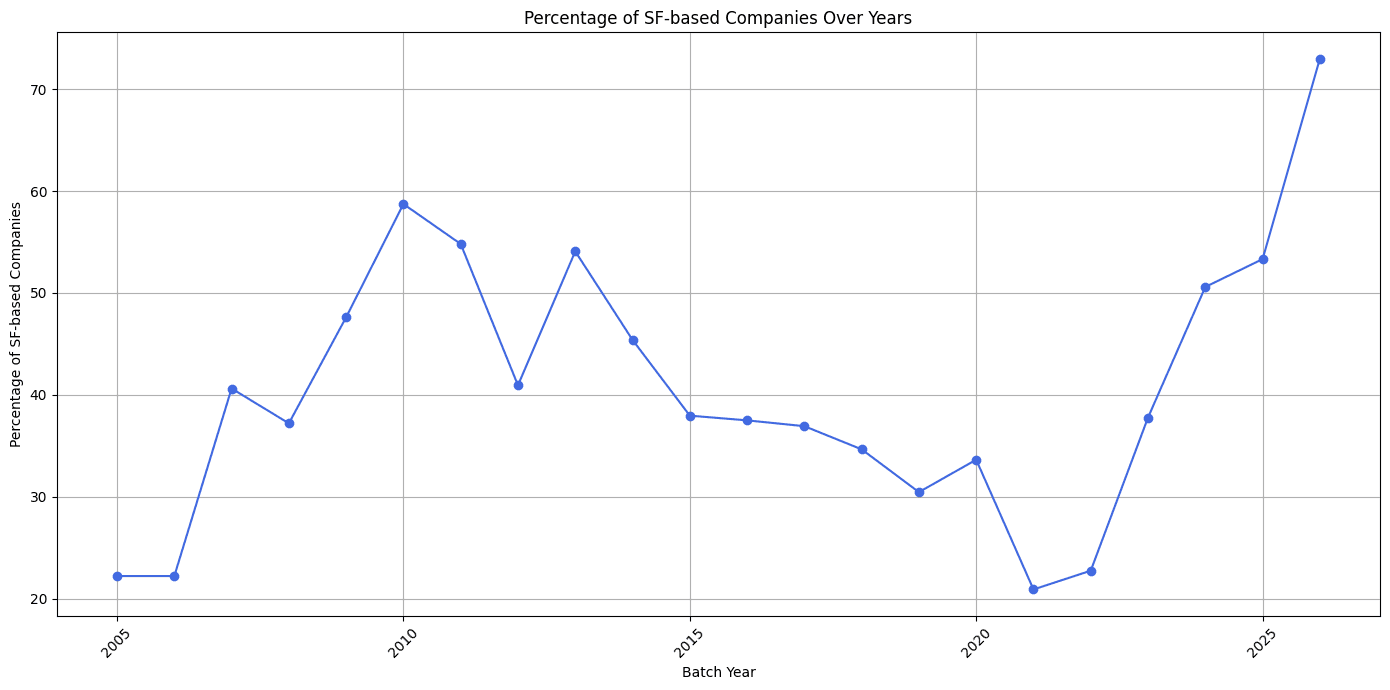
San Francisco’s Share of YC Companies by Year
2005: 22.22%
2010: 58.73%
2017: 36.93%
2019: 30.46%
2021: 20.91%
2023: 37.78%
2024: 50.59%
2025: 53.32%
2026: 72.97%
Three phases are visible in this data.
Phase 1 (2005–2010): Concentration
As YC established itself in the Bay Area and the local ecosystem developed around it, SF's share of each batch grew from 22% to nearly 59%. Small batch sizes (9-63 companies per year) made geographic clustering natural.
Phase 2 (2011–2021): Decentralization
SF's share fell from the mid-50s to 20.91% in 2021. This was the era of "build from anywhere." Remote work, rising Bay Area costs, and YC's push for international expansion drove founders to distribute. At peak batch sizes of 391 and 399 companies, running in-person programming was logistically difficult anyway.
Phase 3 (2022–2026): Reconcentration
SF's share has rebounded from 21% in 2021 to 73% in 2026. That is the highest concentration in YC's history, surpassing even the 2010 peak. It coincides exactly with batch size moderation (93-274 per batch rather than 336-399) and the collapse of remote work.
The implication is not subtle. When batch sizes were massive and the program ran remotely, geography was scattered. When batches shrank and the program returned to in-person, companies clustered back around San Francisco.
The ecosystem's gravitational pull, talent density, investor proximity, and network effects reasserted themselves the moment conditions allowed.
Key Findings From 5,668 Y Combinator Startups For 2026
Analysis of data covering nearly two decades of Y Combinator companies, spanning 5,668 startups across 48 batches, reveals a set of clear, recurring patterns about how successful startups are being built in 2026.
B2B SaaS with AI integration has become the dominant startup model.
A total of 546 companies combine B2B and SaaS tags, with hundreds more layering AI on top. This model, which barely appeared in early YC company descriptions, now defines the most common YC startup. Predictable revenue, clear customer ROI, and scalable economics continue to outperform consumer-focused approaches.
AI has shifted from a category to core infrastructure.
AI consistently appears alongside B2B, SaaS, Fintech, Healthcare, Infrastructure, Developer Tools, and Robotics. Rather than competing with other industries, AI is embedded within them. The data shows AI functioning as a horizontal capability that enhances nearly every category of YC funds.
The barbell team structure is now the norm.
Founders increasingly start with 3 to 5 people, using modern tools to validate quickly and operate with minimal burn. Once product market fit is achieved, companies scale aggressively to 50 to 200 or more employees. The growth-stage mean of 198.59 employees confirms that this pattern is well established among companies that succeed.
Physical proximity has reasserted its importance.
Remote work adoption fell from 83 percent to 14 percent in four years, while San Francisco concentration rose from 21 percent to 73 percent in five years. These are sharp reversals, not gradual shifts. The data suggests that in-person collaboration, ecosystem density, and proximity to talent and capital offer advantages that distributed teams struggle to replicate at the earliest stages.
Specialization continues to outperform generalization.
The number of subindustries funded by YC grew sevenfold from 8 to 57, indicating a strong move toward vertical depth. Examples like Fintech to Insurance, Healthcare to Therapeutics, and B2B to Engineering and Design highlight how domain expertise creates defensible positions that broad horizontal platforms increasingly fail to achieve.
Batch size has meaningful strategic consequences.
The mega-batches of 2021 and 2022, with 391 to 399 companies, enabled global diversification but coincided with lower San Francisco concentration, higher remote work, and greater international spread.
As YC shifted back to smaller batches of 100 to 250 companies, geographic concentration increased, in-person operations returned, and US focus strengthened. The transition to four smaller annual batches appears to be a deliberate recalibration rather than a temporary adjustment.
An Execution-First Alternative to Traditional Accelerators
The patterns in this data point toward smaller teams, faster iteration, and deeper technical work earlier in a company’s life. As a result, some founders are moving away from cohort-based accelerators toward more execution-focused support models.
Rather than structured programs built around mentorship sessions and demo days, these models emphasize direct collaboration with experienced engineers, AI developers, and product designers. Progress is measured in shipped features, infrastructure decisions, and real user feedback.
Ellenox Venture Studio operates within this execution-first approach, supporting early-stage teams through hands-on product development instead of time-bound accelerator programs. This structure closely reflects the startup patterns observed across the most successful Y Combinator companies.
For teams exploring this execution-first approach, we’re always open to conversations at Ellenox.